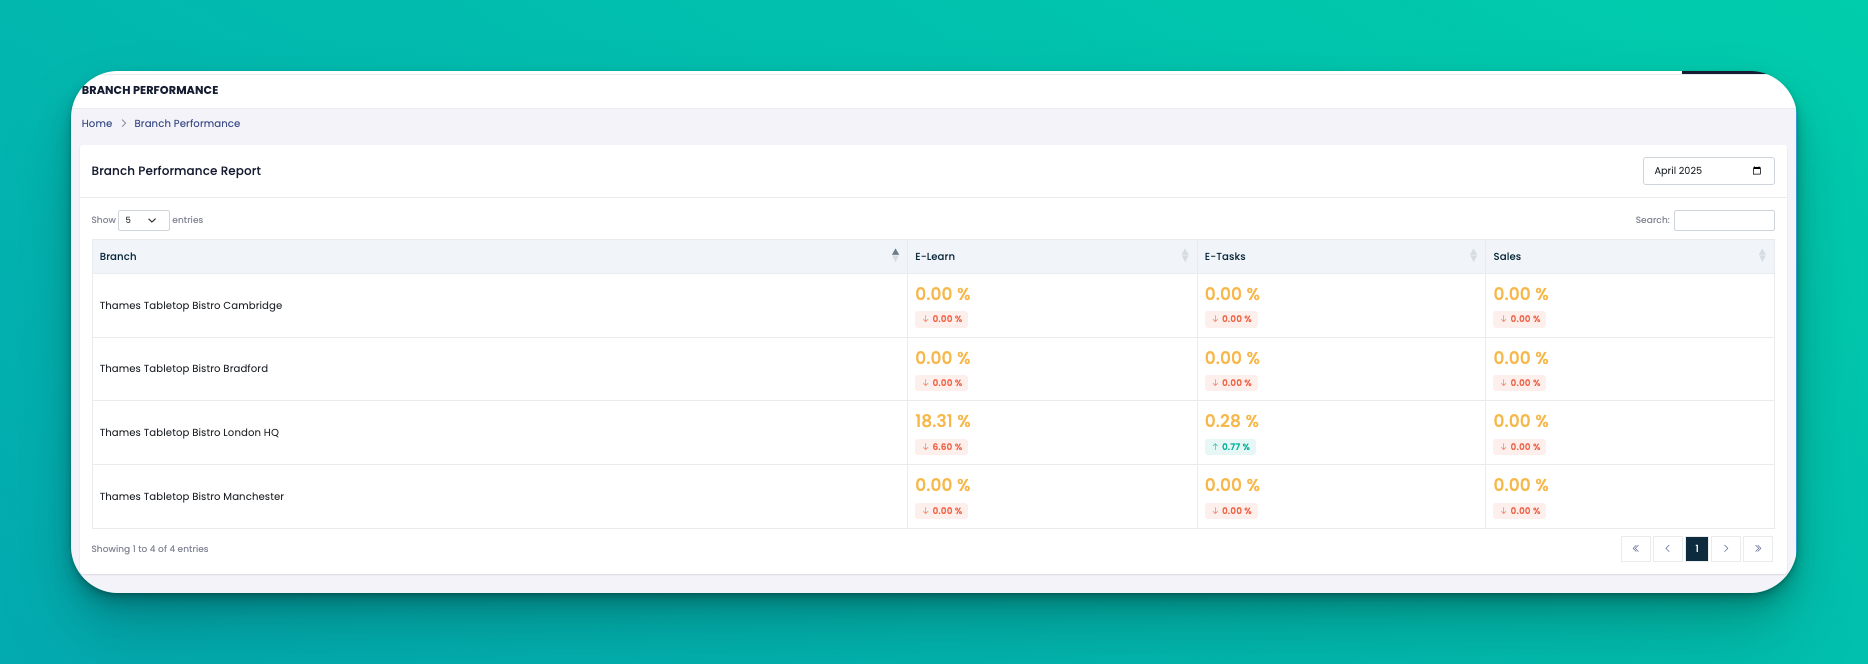
The Branch Performance Report provides a monthly summary of how each branch is performing across three key areas: E-Learn, E-Tasks, and Sales. This allows Head Office and Area Managers to compare productivity and engagement across all locations.
At the top of the page:
Use the Month selector to choose the desired reporting month.
The report will auto-refresh to display data for that time period.
Each branch is listed along with percentage performance in the following areas:
E-Learn Completion Rate – Measures how many staff completed assigned training courses.
E-Tasks Completion Rate – Tracks task completion within that branch.
Sales – Reflects sales performance, showing growth or decline percentage.
Next to each figure, you'll also see:
📉 A red indicator for decline
📈 A green indicator for growth (with exact % difference from the previous month)
Use this data to reward high-performing branches or investigate underperformance.
Look for trends across branches — for example, if e-Learn completion is down across the board, more training encouragement may be needed.
Combine this report with attendance and task data for a 360° operational view.
Q: What does 0.00% mean in all three columns?
This means there was no recorded activity in e-Learn, e-Tasks, or Sales for that branch during the selected month.
Q: What does the green or red value under the percentage mean?
It shows how much the performance has improved or declined compared to the previous month.
Q: Can I download this report?
Not directly from this page, but you can take a screenshot or use browser tools to print or save.