The Sales vs Expenses feature helps you track your company’s spending in detail — by showing where the money is going, how much tax is involved, and the total amount spent in each category (like electricity, broadband, cleaning supplies, etc.).
It gives you a clear breakdown of all your fixed and variable expenses, allowing you to:
Stay on top of daily or monthly costs
Compare branch-level spending
Identify unnecessary or unexpected expenses
Get a full picture of financial health

Filter Your View
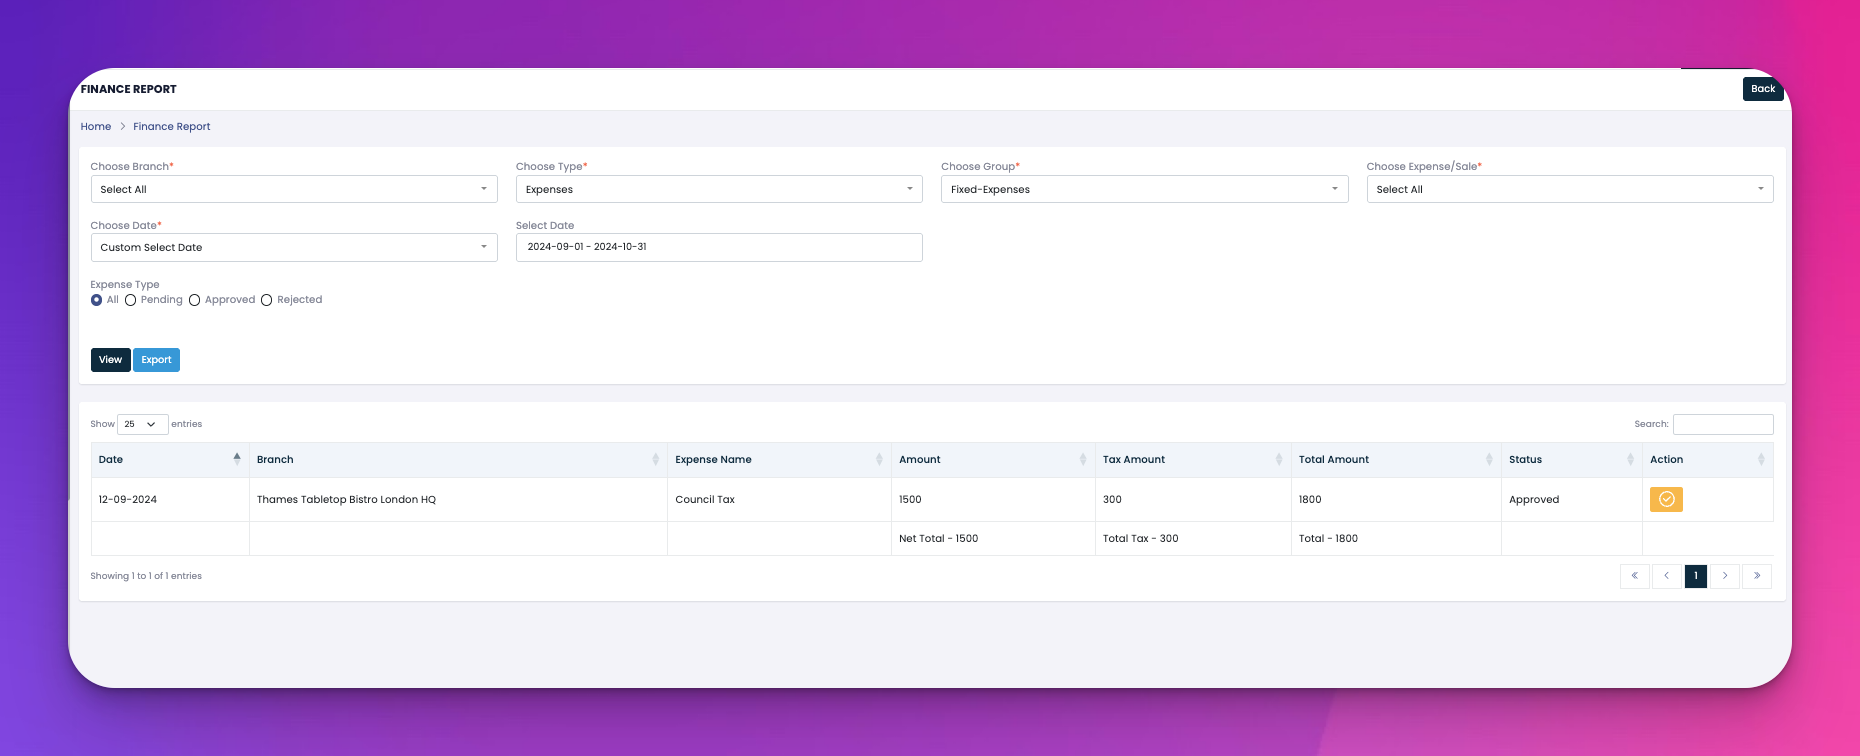
At the top, you can choose:
Branch – e.g., London HQ, Notting Hill
Expense Group – Fixed or Variable
Expense Type – Approved, Rejected, Pending
Date Range – Like yesterday, this week, or a custom date
Auto-Fetched Data
The system automatically pulls all the expenses that match your selected filters and displays them in a table below.
Columns Show:
Date of the expense
Branch where the expense was recorded
Expense Name (e.g., Gas Bill)
Amount before tax
Tax Amount (calculated automatically)
Total Amount (amount + tax)
Status (Pending, Approved, Rejected)
Actions
On the far right, each entry has an icon that lets you view more details or sometimes edit/approve/reject (depending on user role and settings).
Auto-Summary
At the bottom of the table:
Total Expense (before tax)
Total Tax
Final Grand Total
Export Option
You can download this data as a report to share or keep records.
✅ Sales vs Expenses shows you where the money is going.
⚙️ It pulls data based on your filters and summarizes all amounts.
📁 You can export everything for records or reports.